Bus Travel Patterns of Migrant Workers Living in Woodlands Dormitories
An analysis of origin-destination bus travel data around migrant dorms in Woodlands.
Background
Migrant worker welfare was severly affected during the Covid pandemic. Many couples were disappointed when construction of BTO (build-to-order) flats was delayed because of the shortage of workers who were held in their dorms because of COVID. News like this revealed Singapore’s reliance on migrant workers in key areas like construction.
With the increasing awareness of migrant worker’s lack of welfare, this project came from an interest in the travel constraints of migrant workers to reach amenities like healthcare and groceries.
Goal
My goal was to understand the following.
-
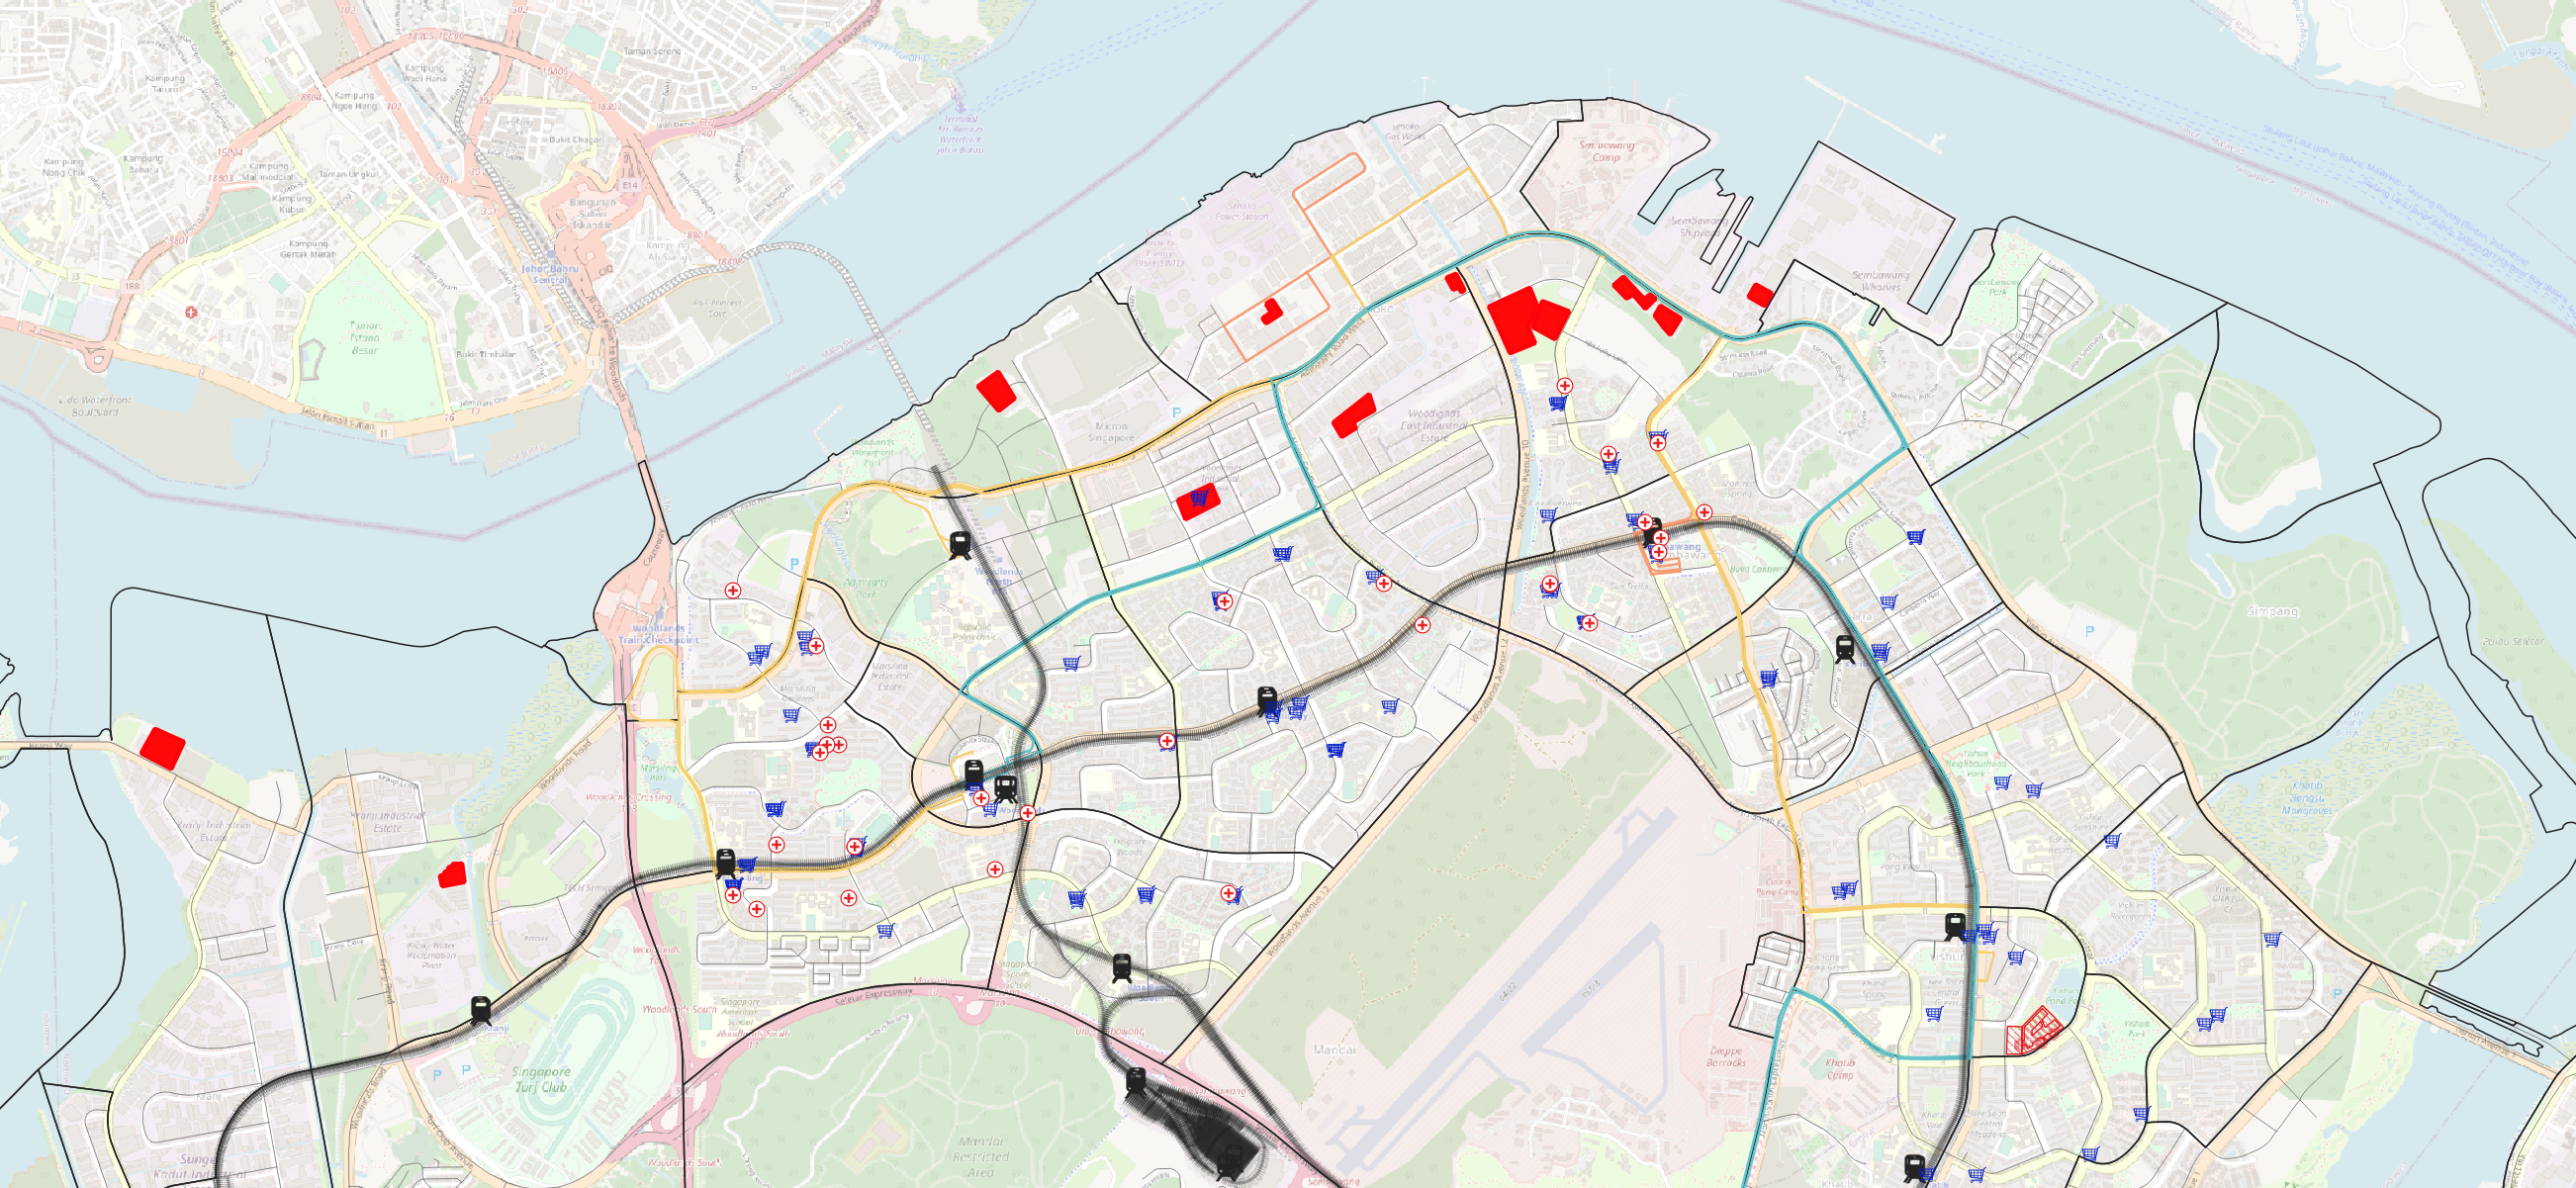
What kind of amenities are around the migrant worker dorms in Woodlands?
-
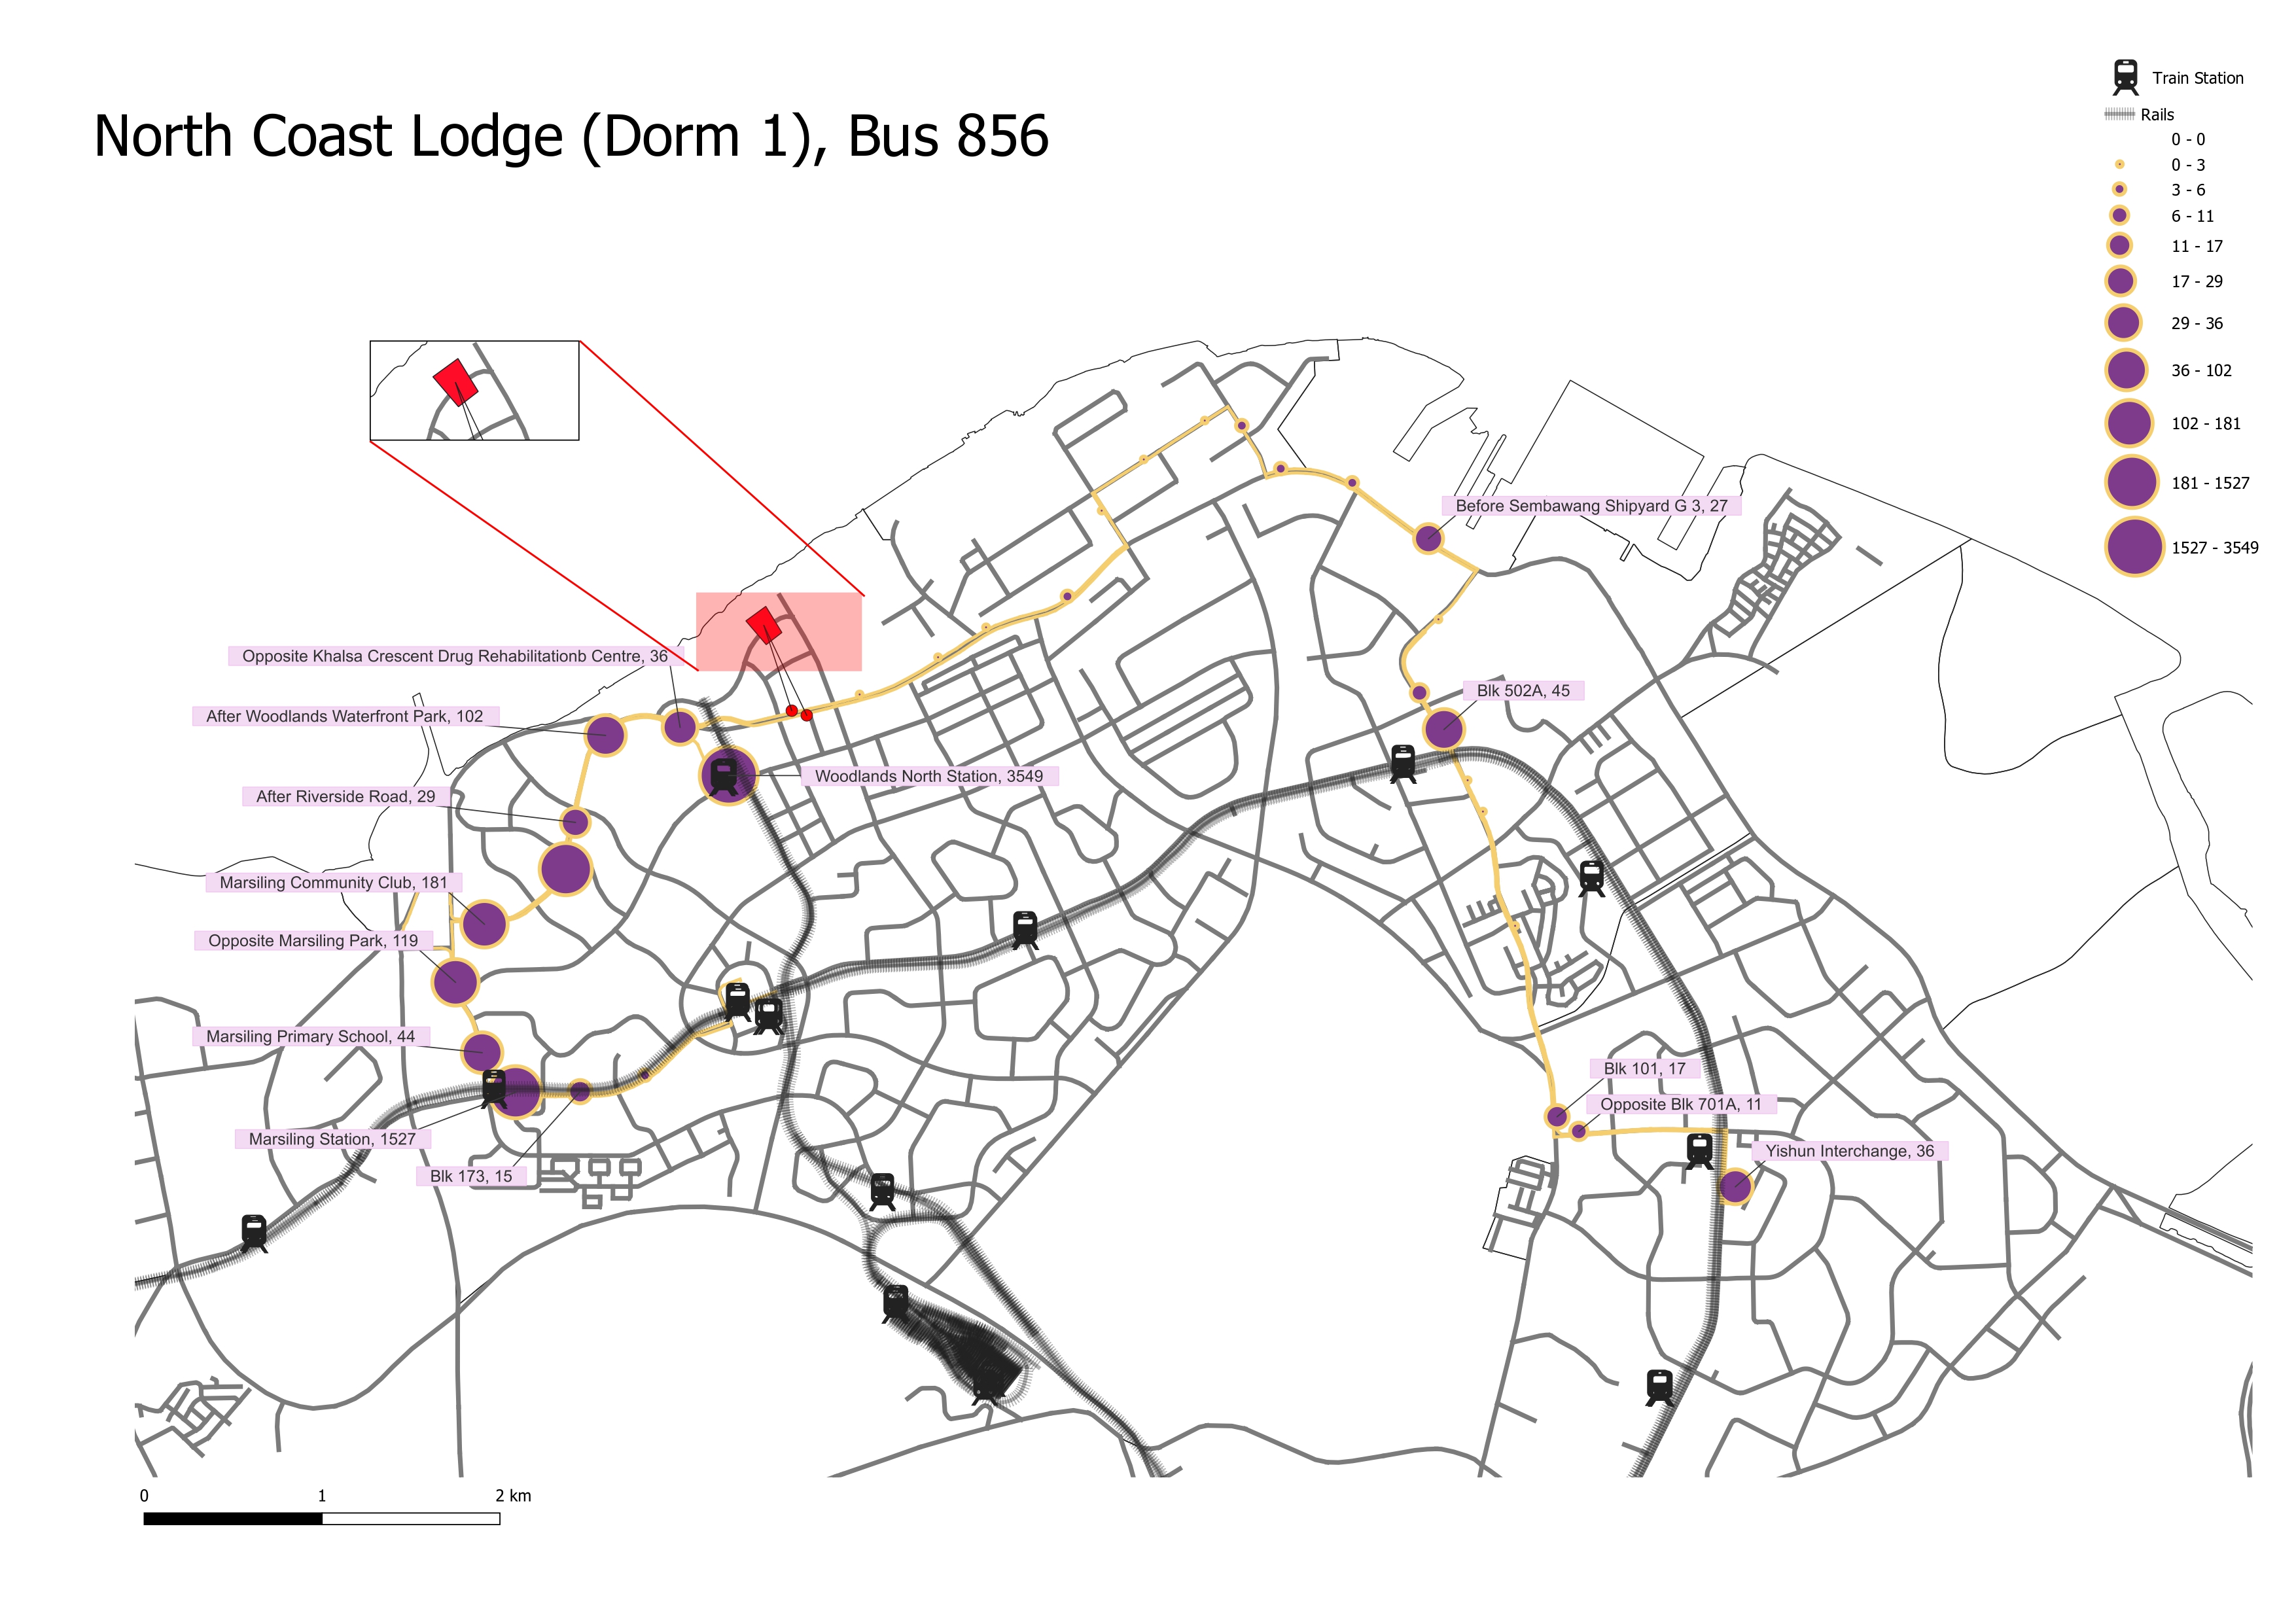
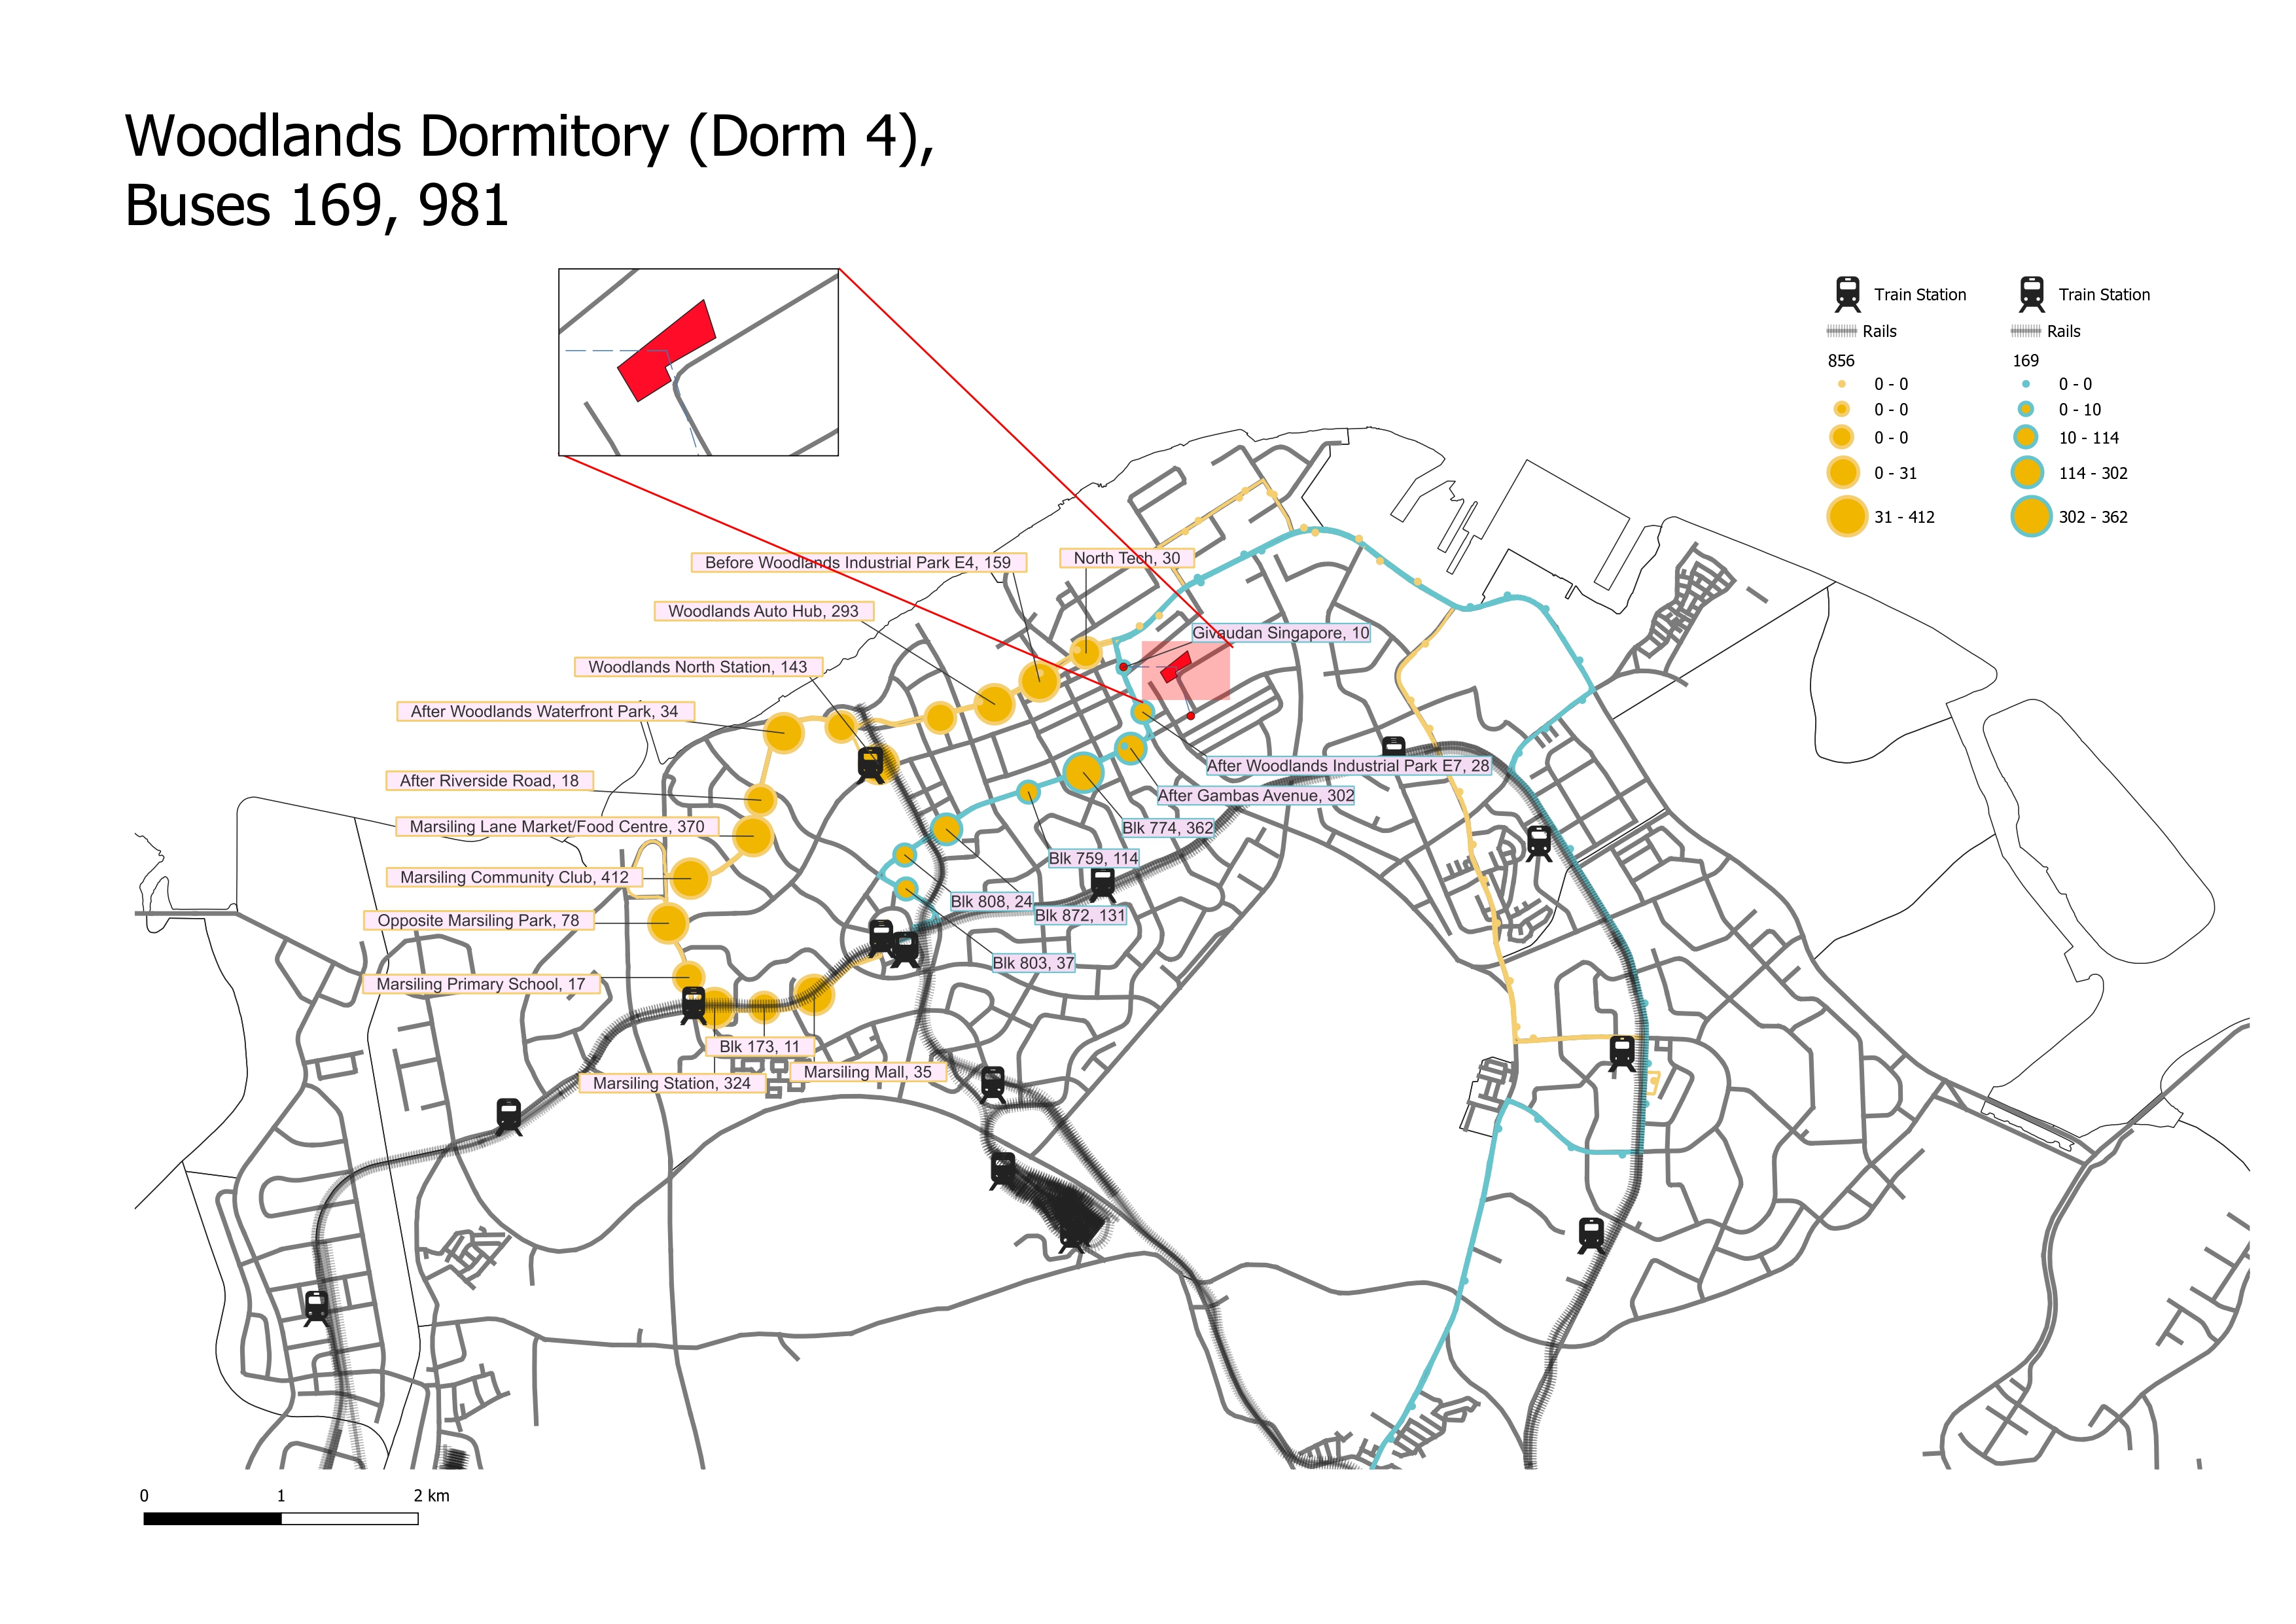
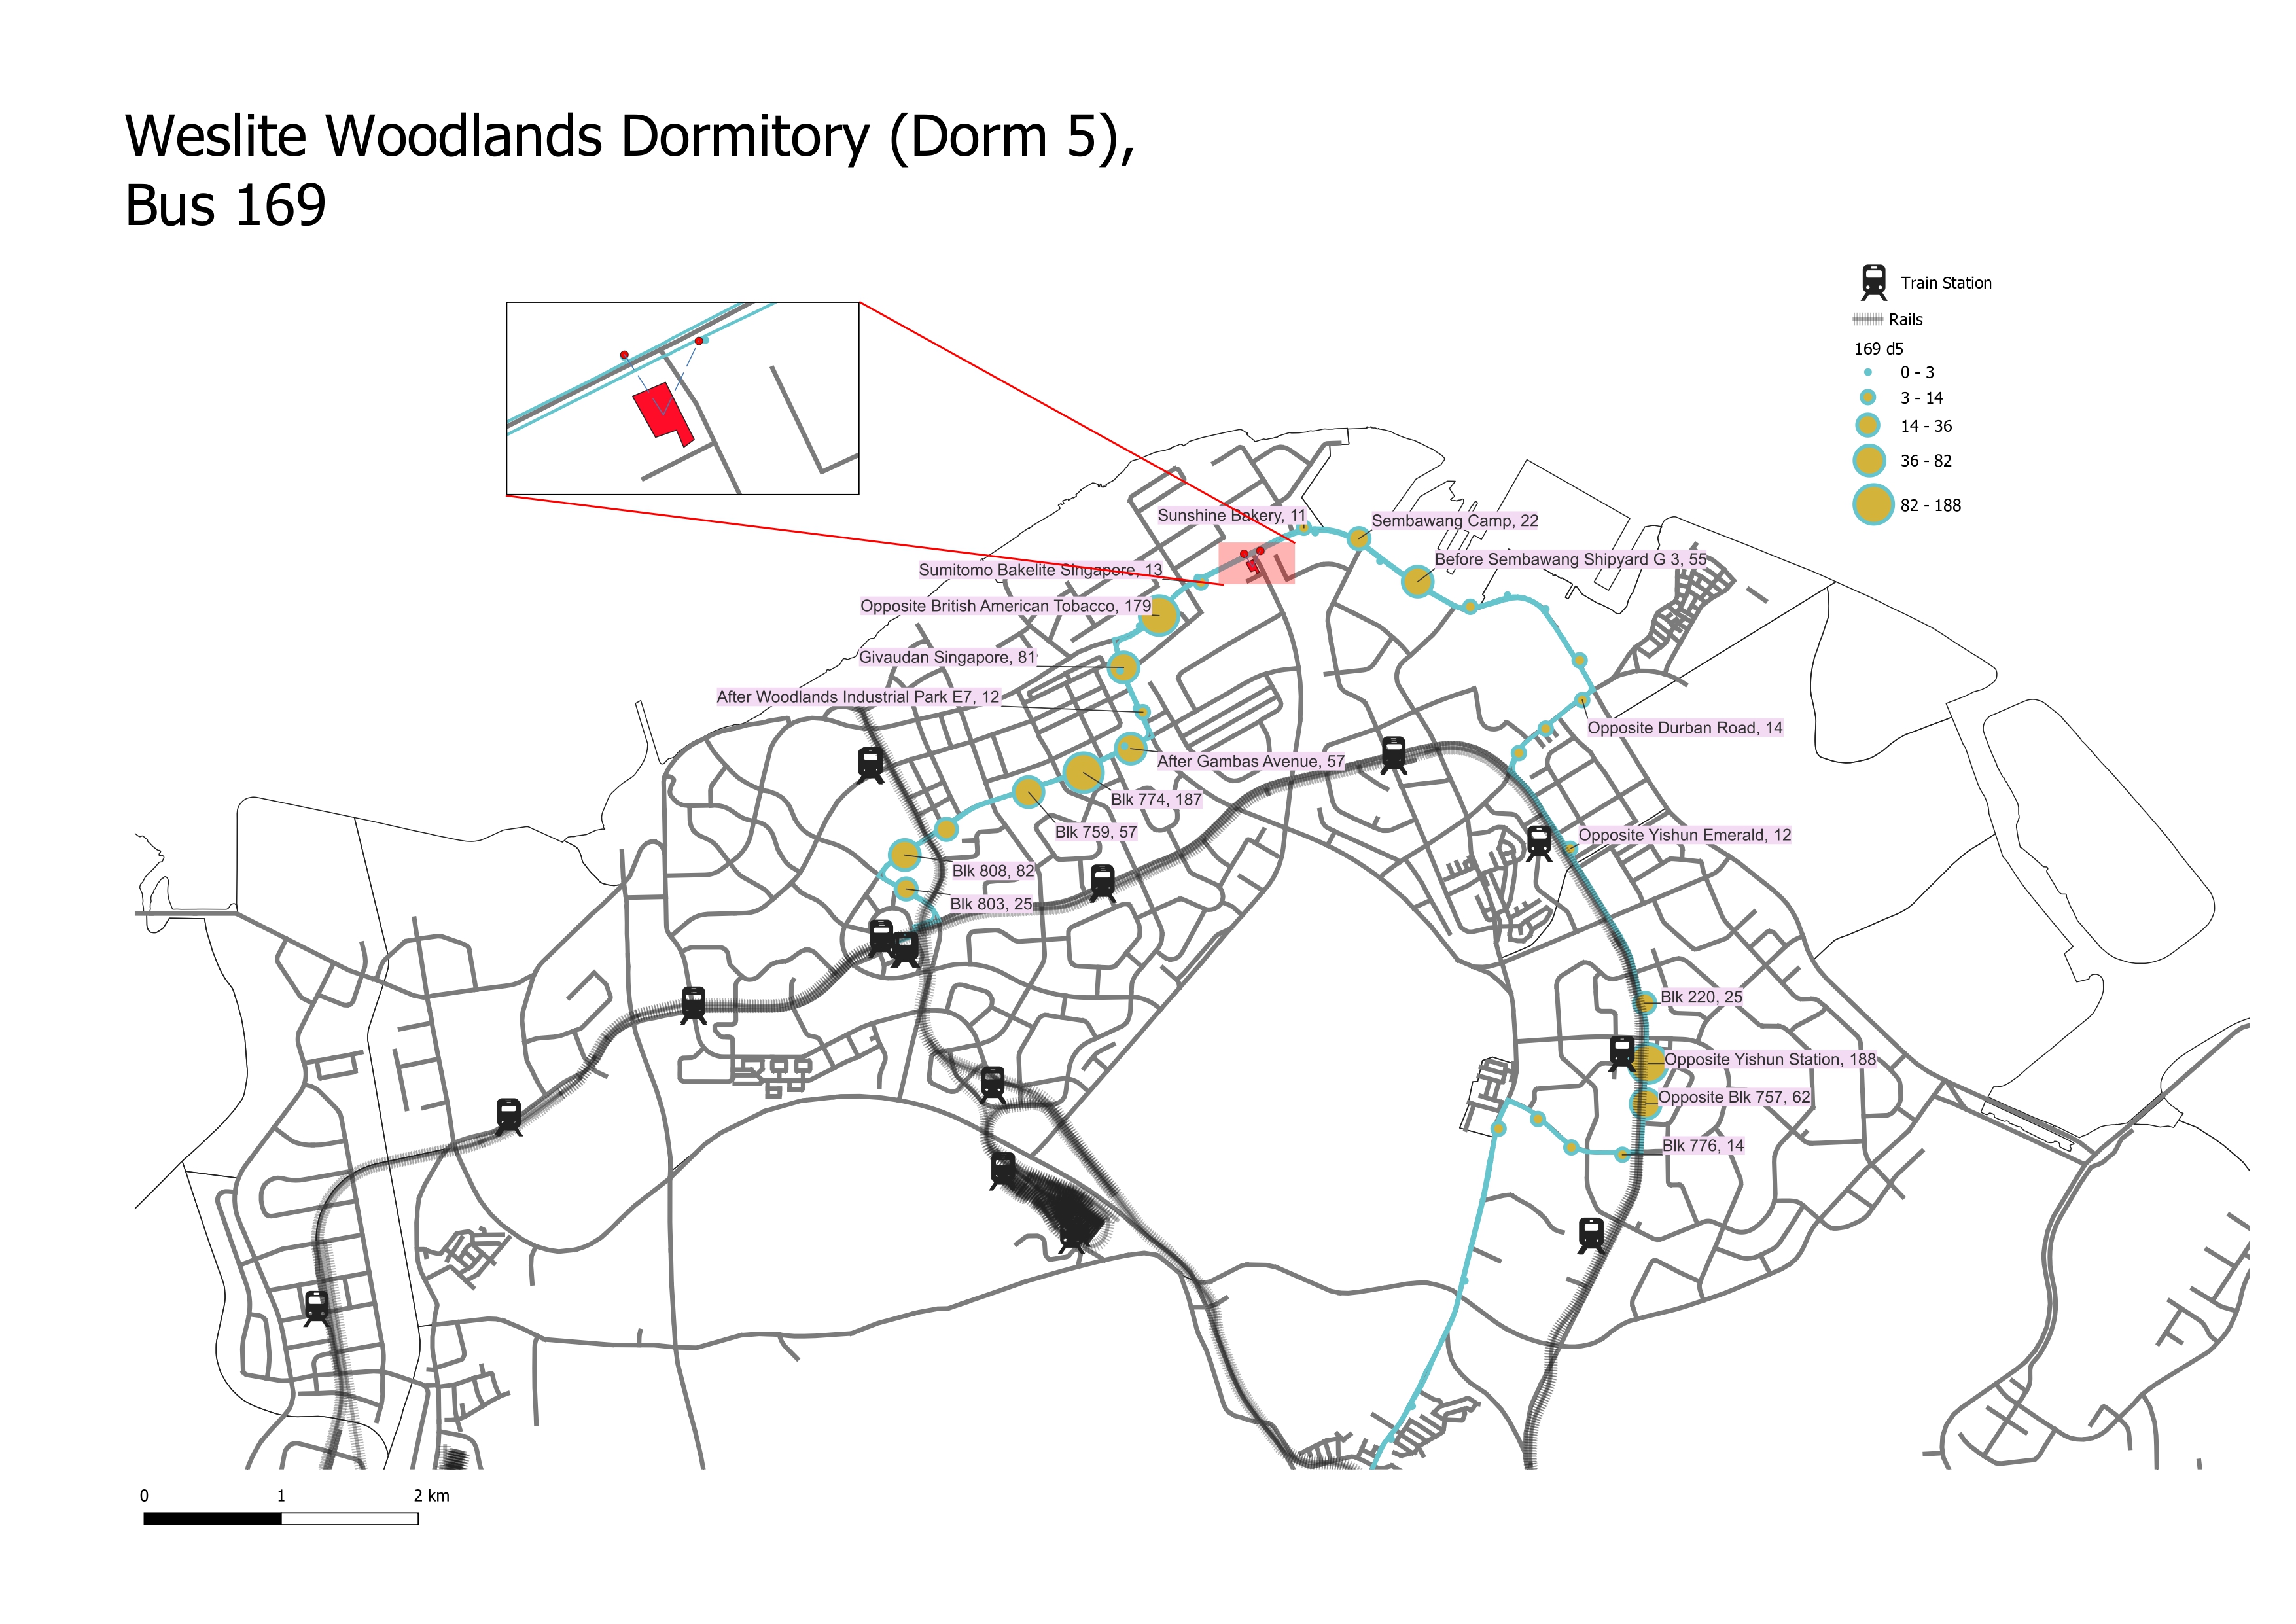
Where do migrant workers travel to by bus, and what kind of amenities are there?
Data
1. Origin-Destination Bus Travel Data
I obtained bus origin-destination data from LTA’s open data platform, LTA DataMall. I was only able to obtain bus travel data for the months of July, August and September because of LTA’s limits.
| Column Name | Data Type | Description |
|---|---|---|
YEAR_MONTH |
chr | Time in YY-MM format. |
DAY_TYPE |
chr | The category of data, indicates if the data is for weekdays or weekends. |
TIME_PER_HOUR |
num | Time of the data, from 0 to 23 |
PT_TYPE |
chr | Public transport type, same value for all cells - bus. |
ORIGIN_PT_CODE |
num | Unique bus stop code from where the commuter boarded the bus. |
DESTINATION_PT_CODE |
num | Unique bus stop code from where the commuter alighted from the bus. |
TOTAL_TRIPS |
num | Total number of unique trips made from the same origin-destination pair for that month. |
2. Open Street Map (OSM) Bus Route Data
I used Open Street Map to extract the bus routes that pass by the dormitories located around Woodlands industrial area.
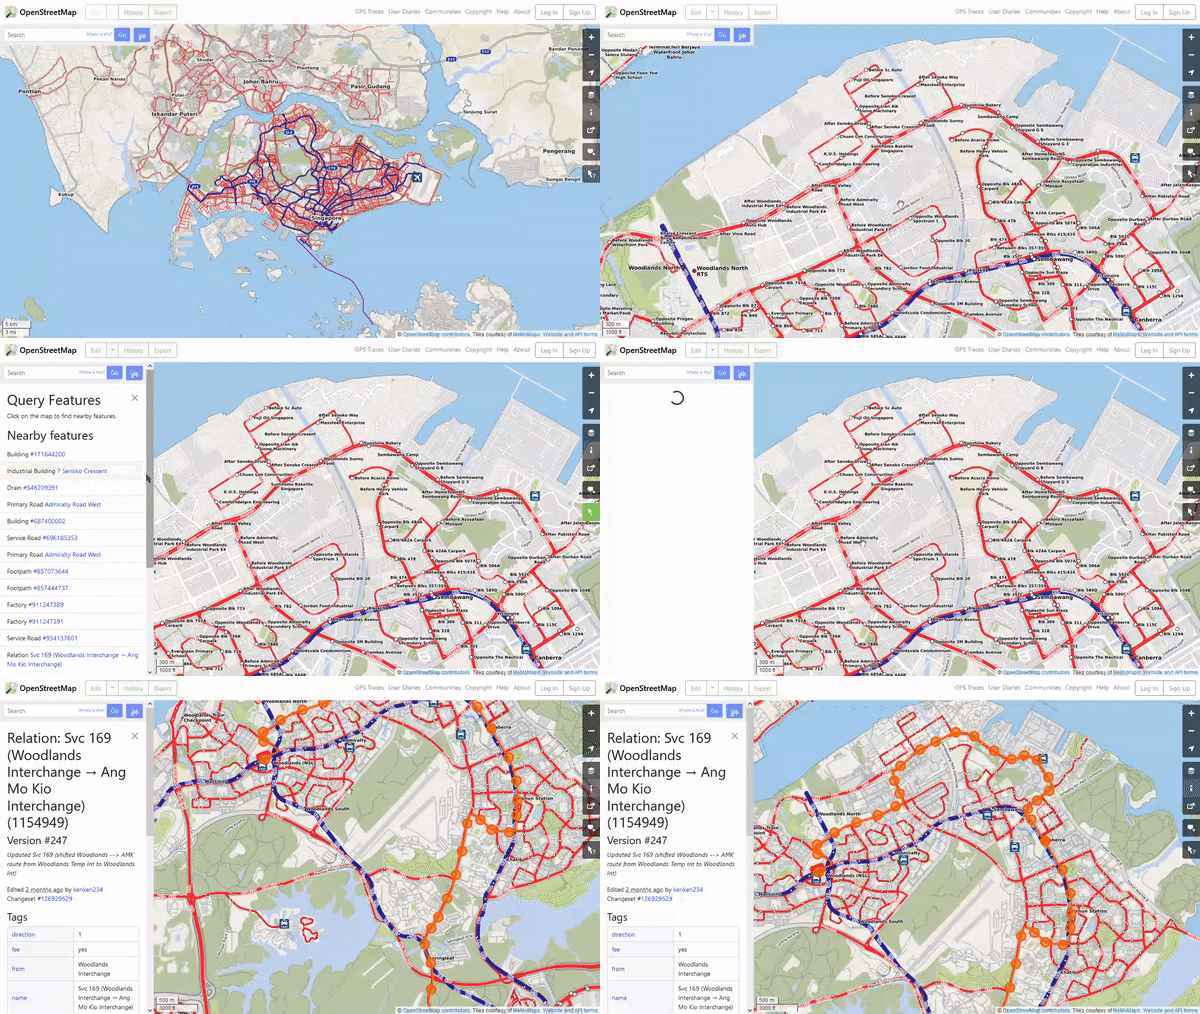
From OpenStreetMap, I imported the nodes into a CSV data set for cleaning.
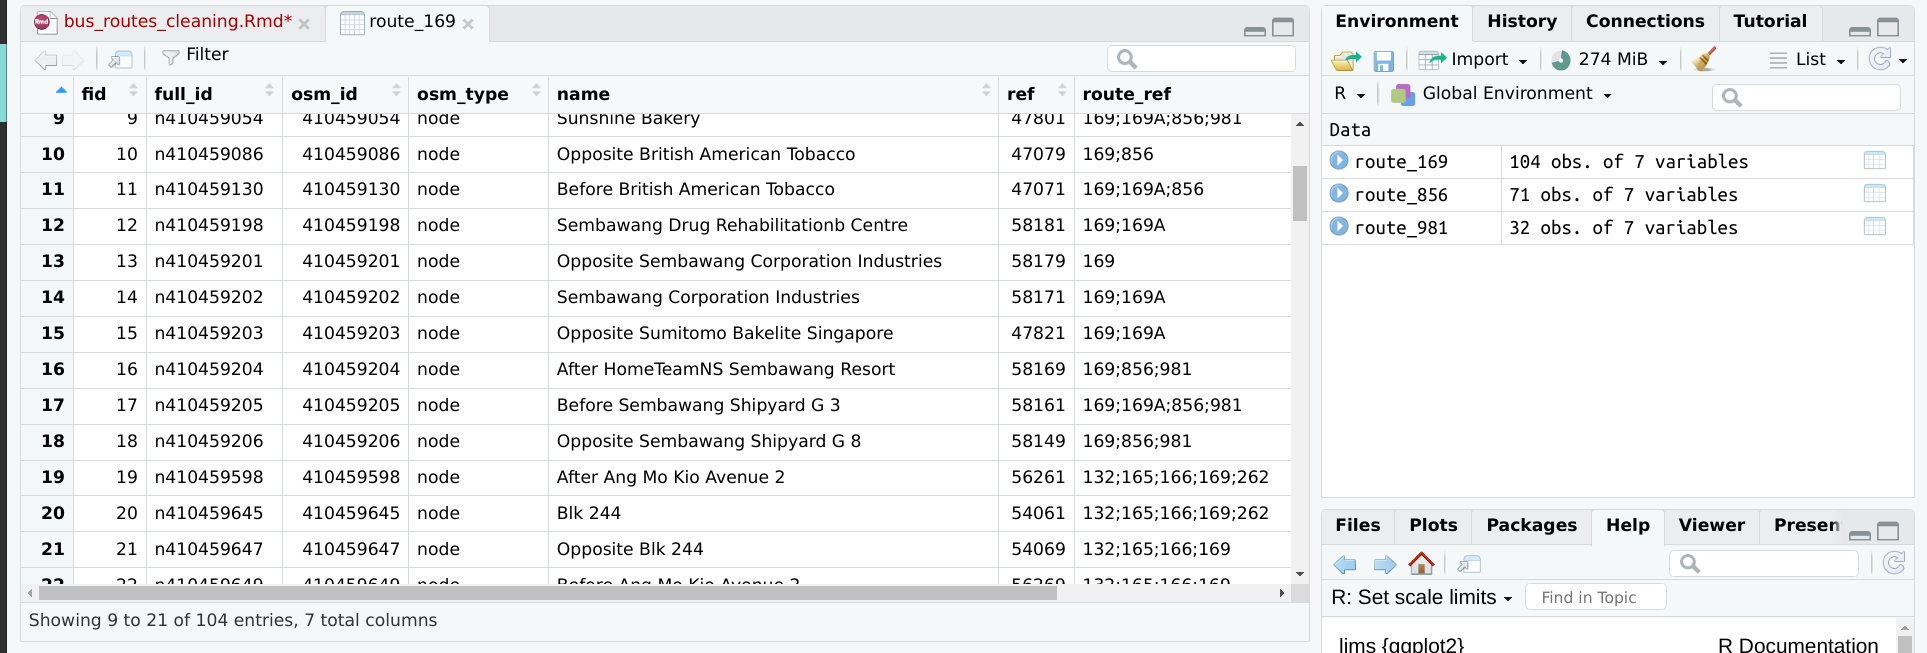 (Screenshot of bus 169’s route, taken from OpenStreetMap)
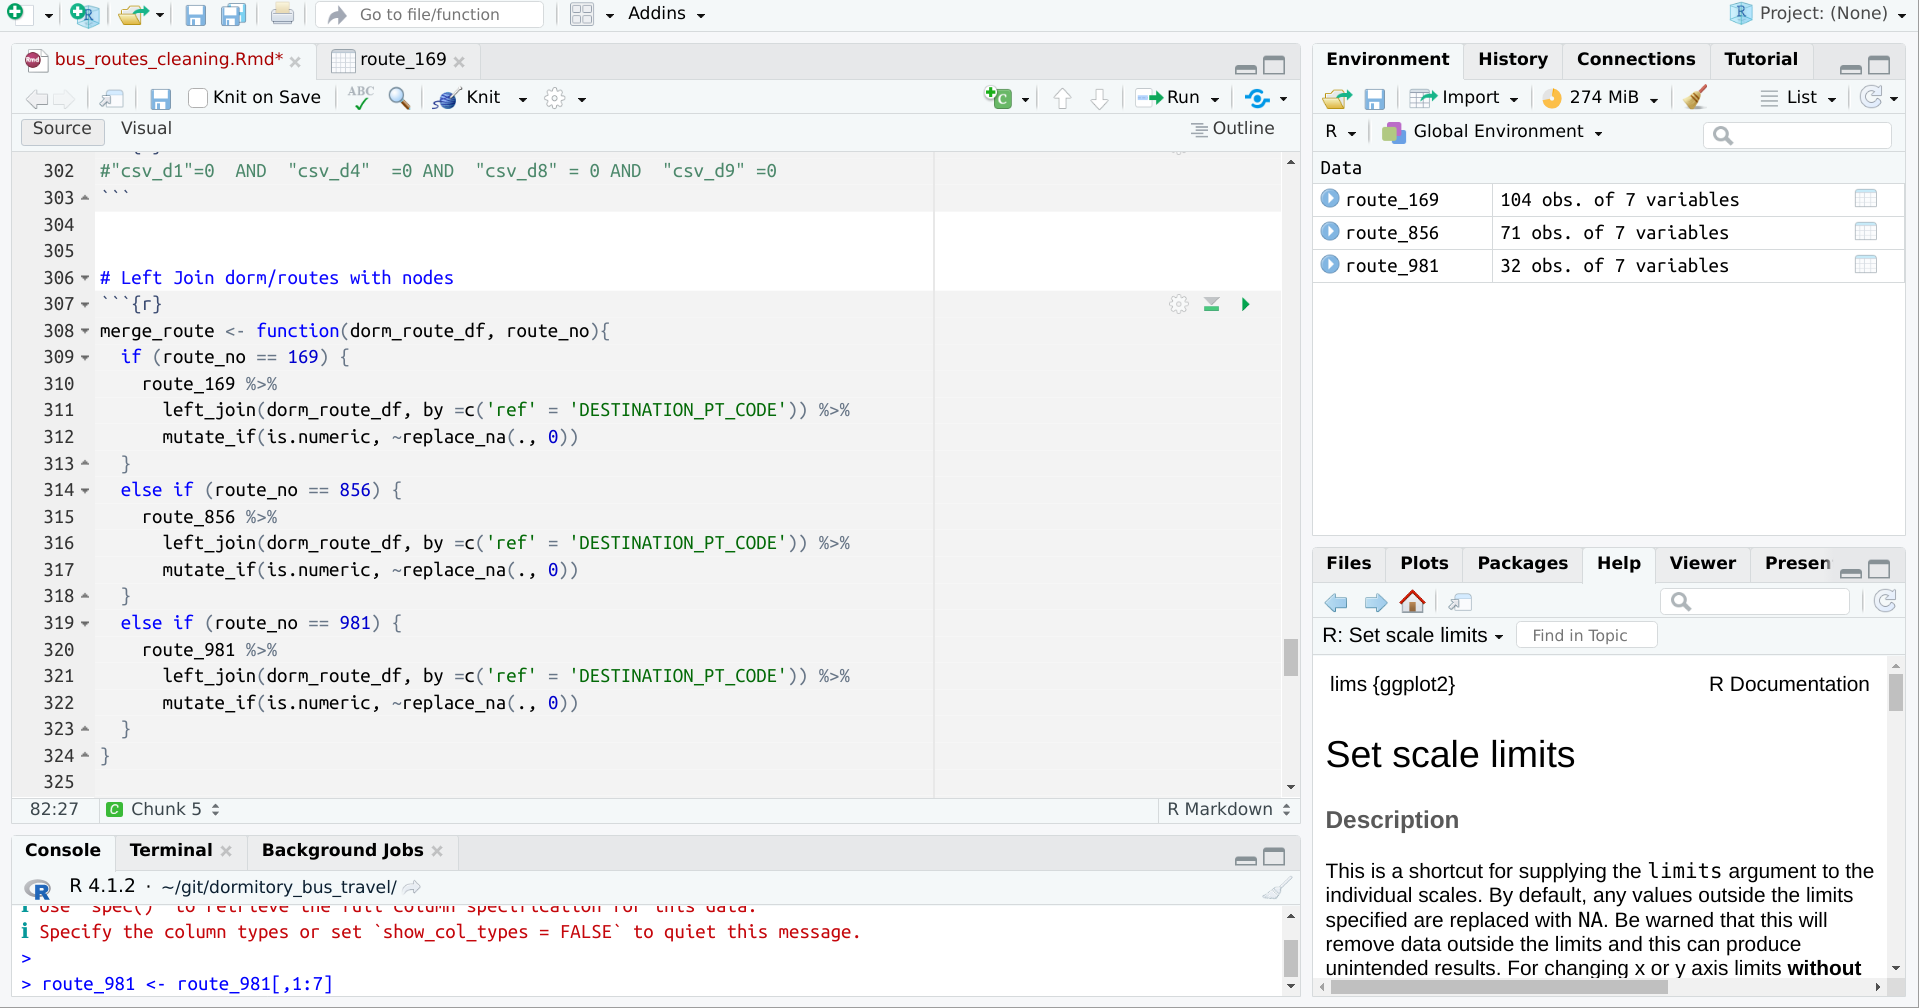 (A portion of my functional cleaning script. Full notebook is in my Github)
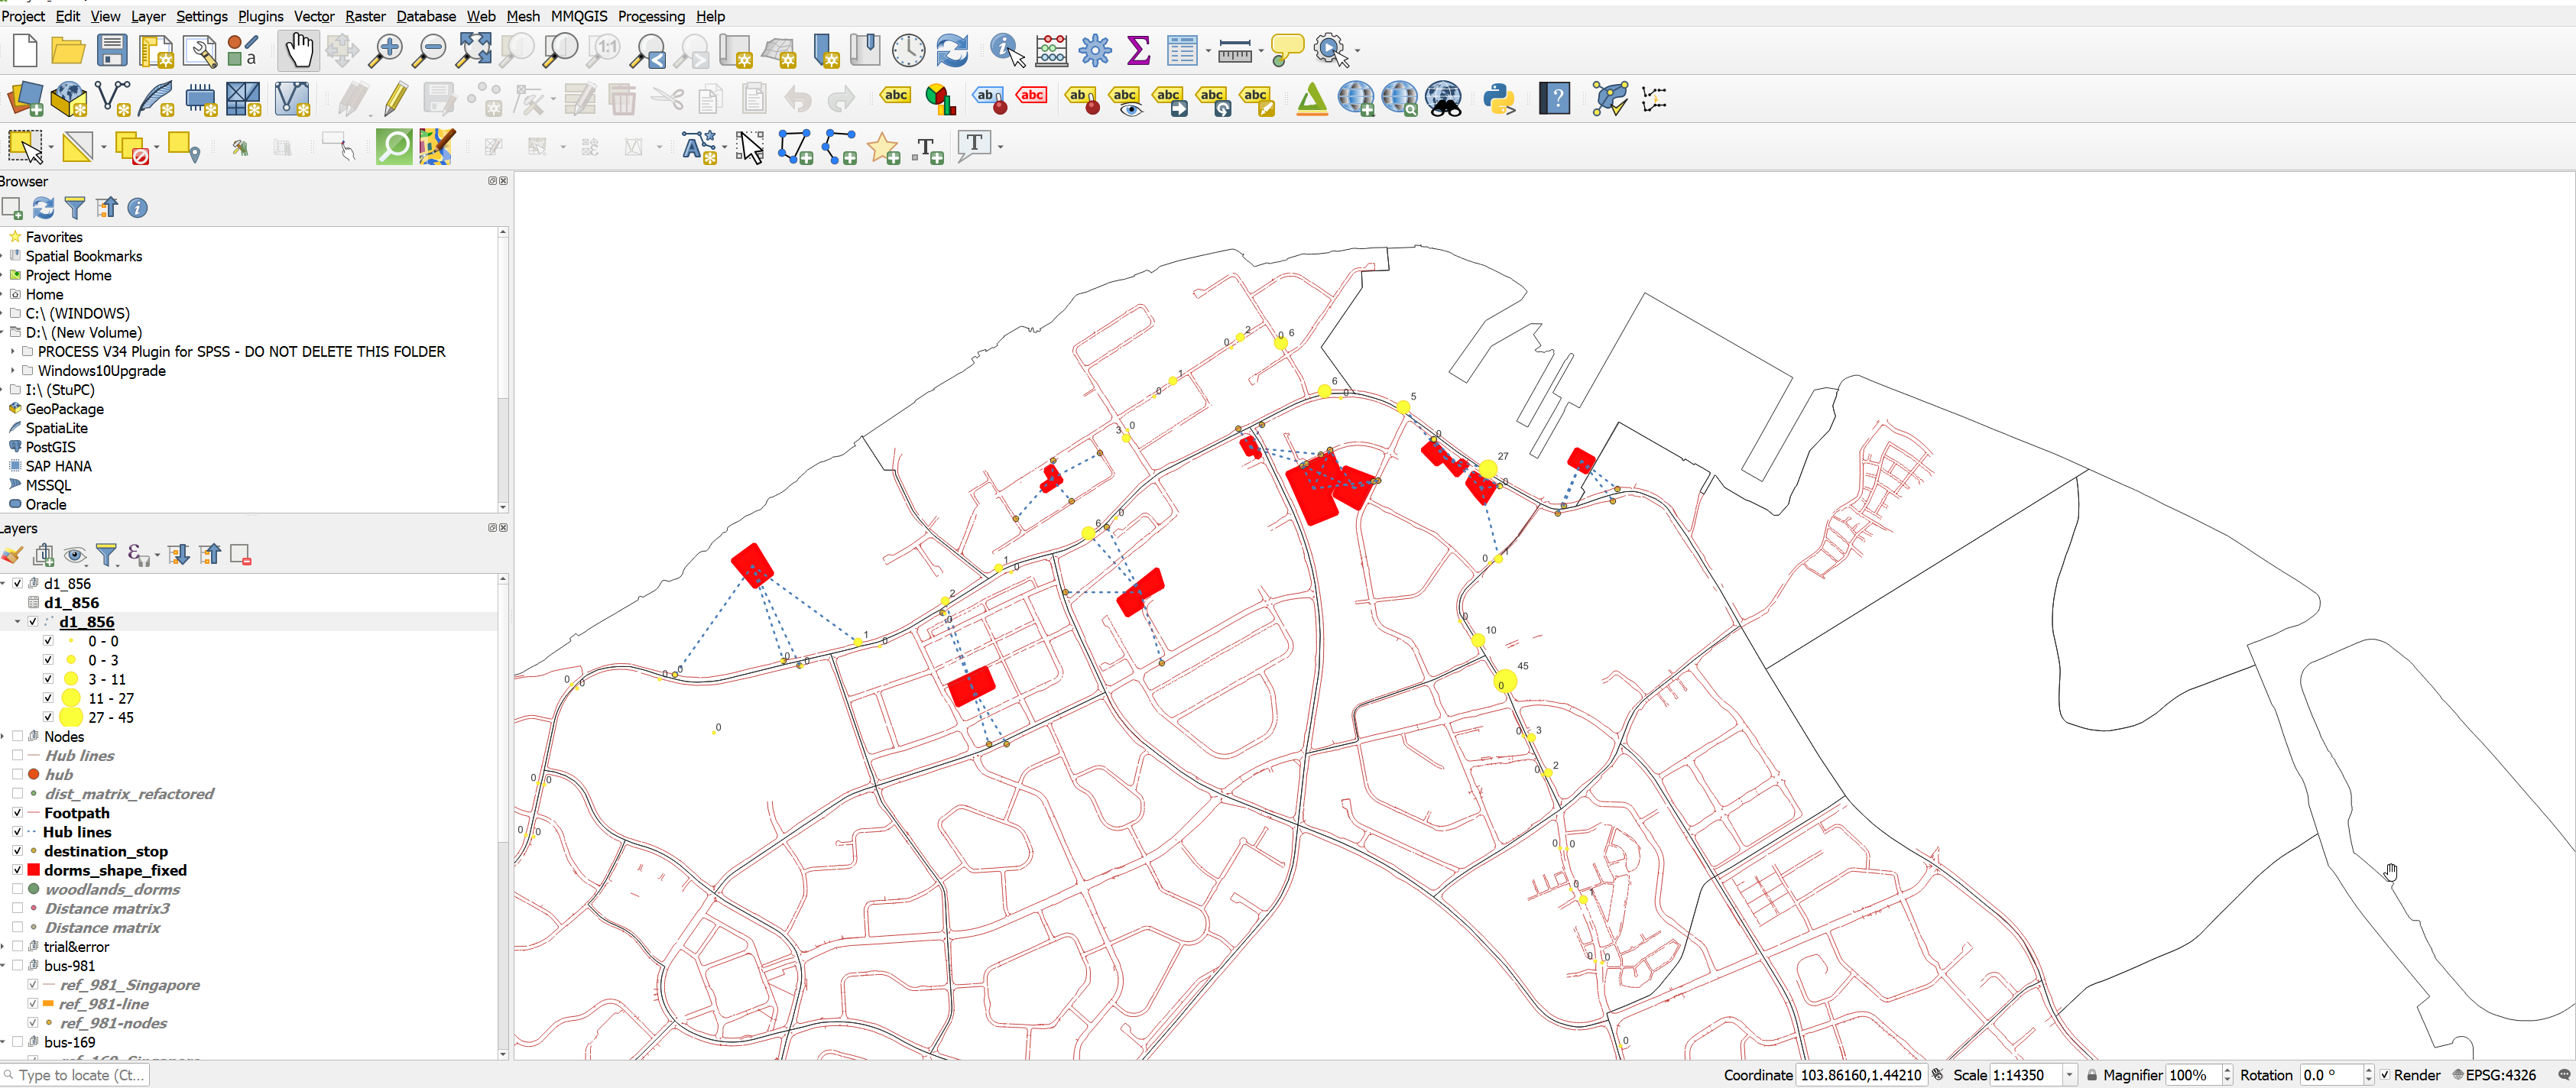
I worked on the weak assumption that migrant workers would use the 2 closest bus stop to their dorm. The image below shows dotted lines that connects dorms in red to the nearest bus stops in yellow.
Results
after some processing…
Amenities
Travel Patterns
You may mouse over the image to inspect the map. Please refresh the page if you have resized the window.


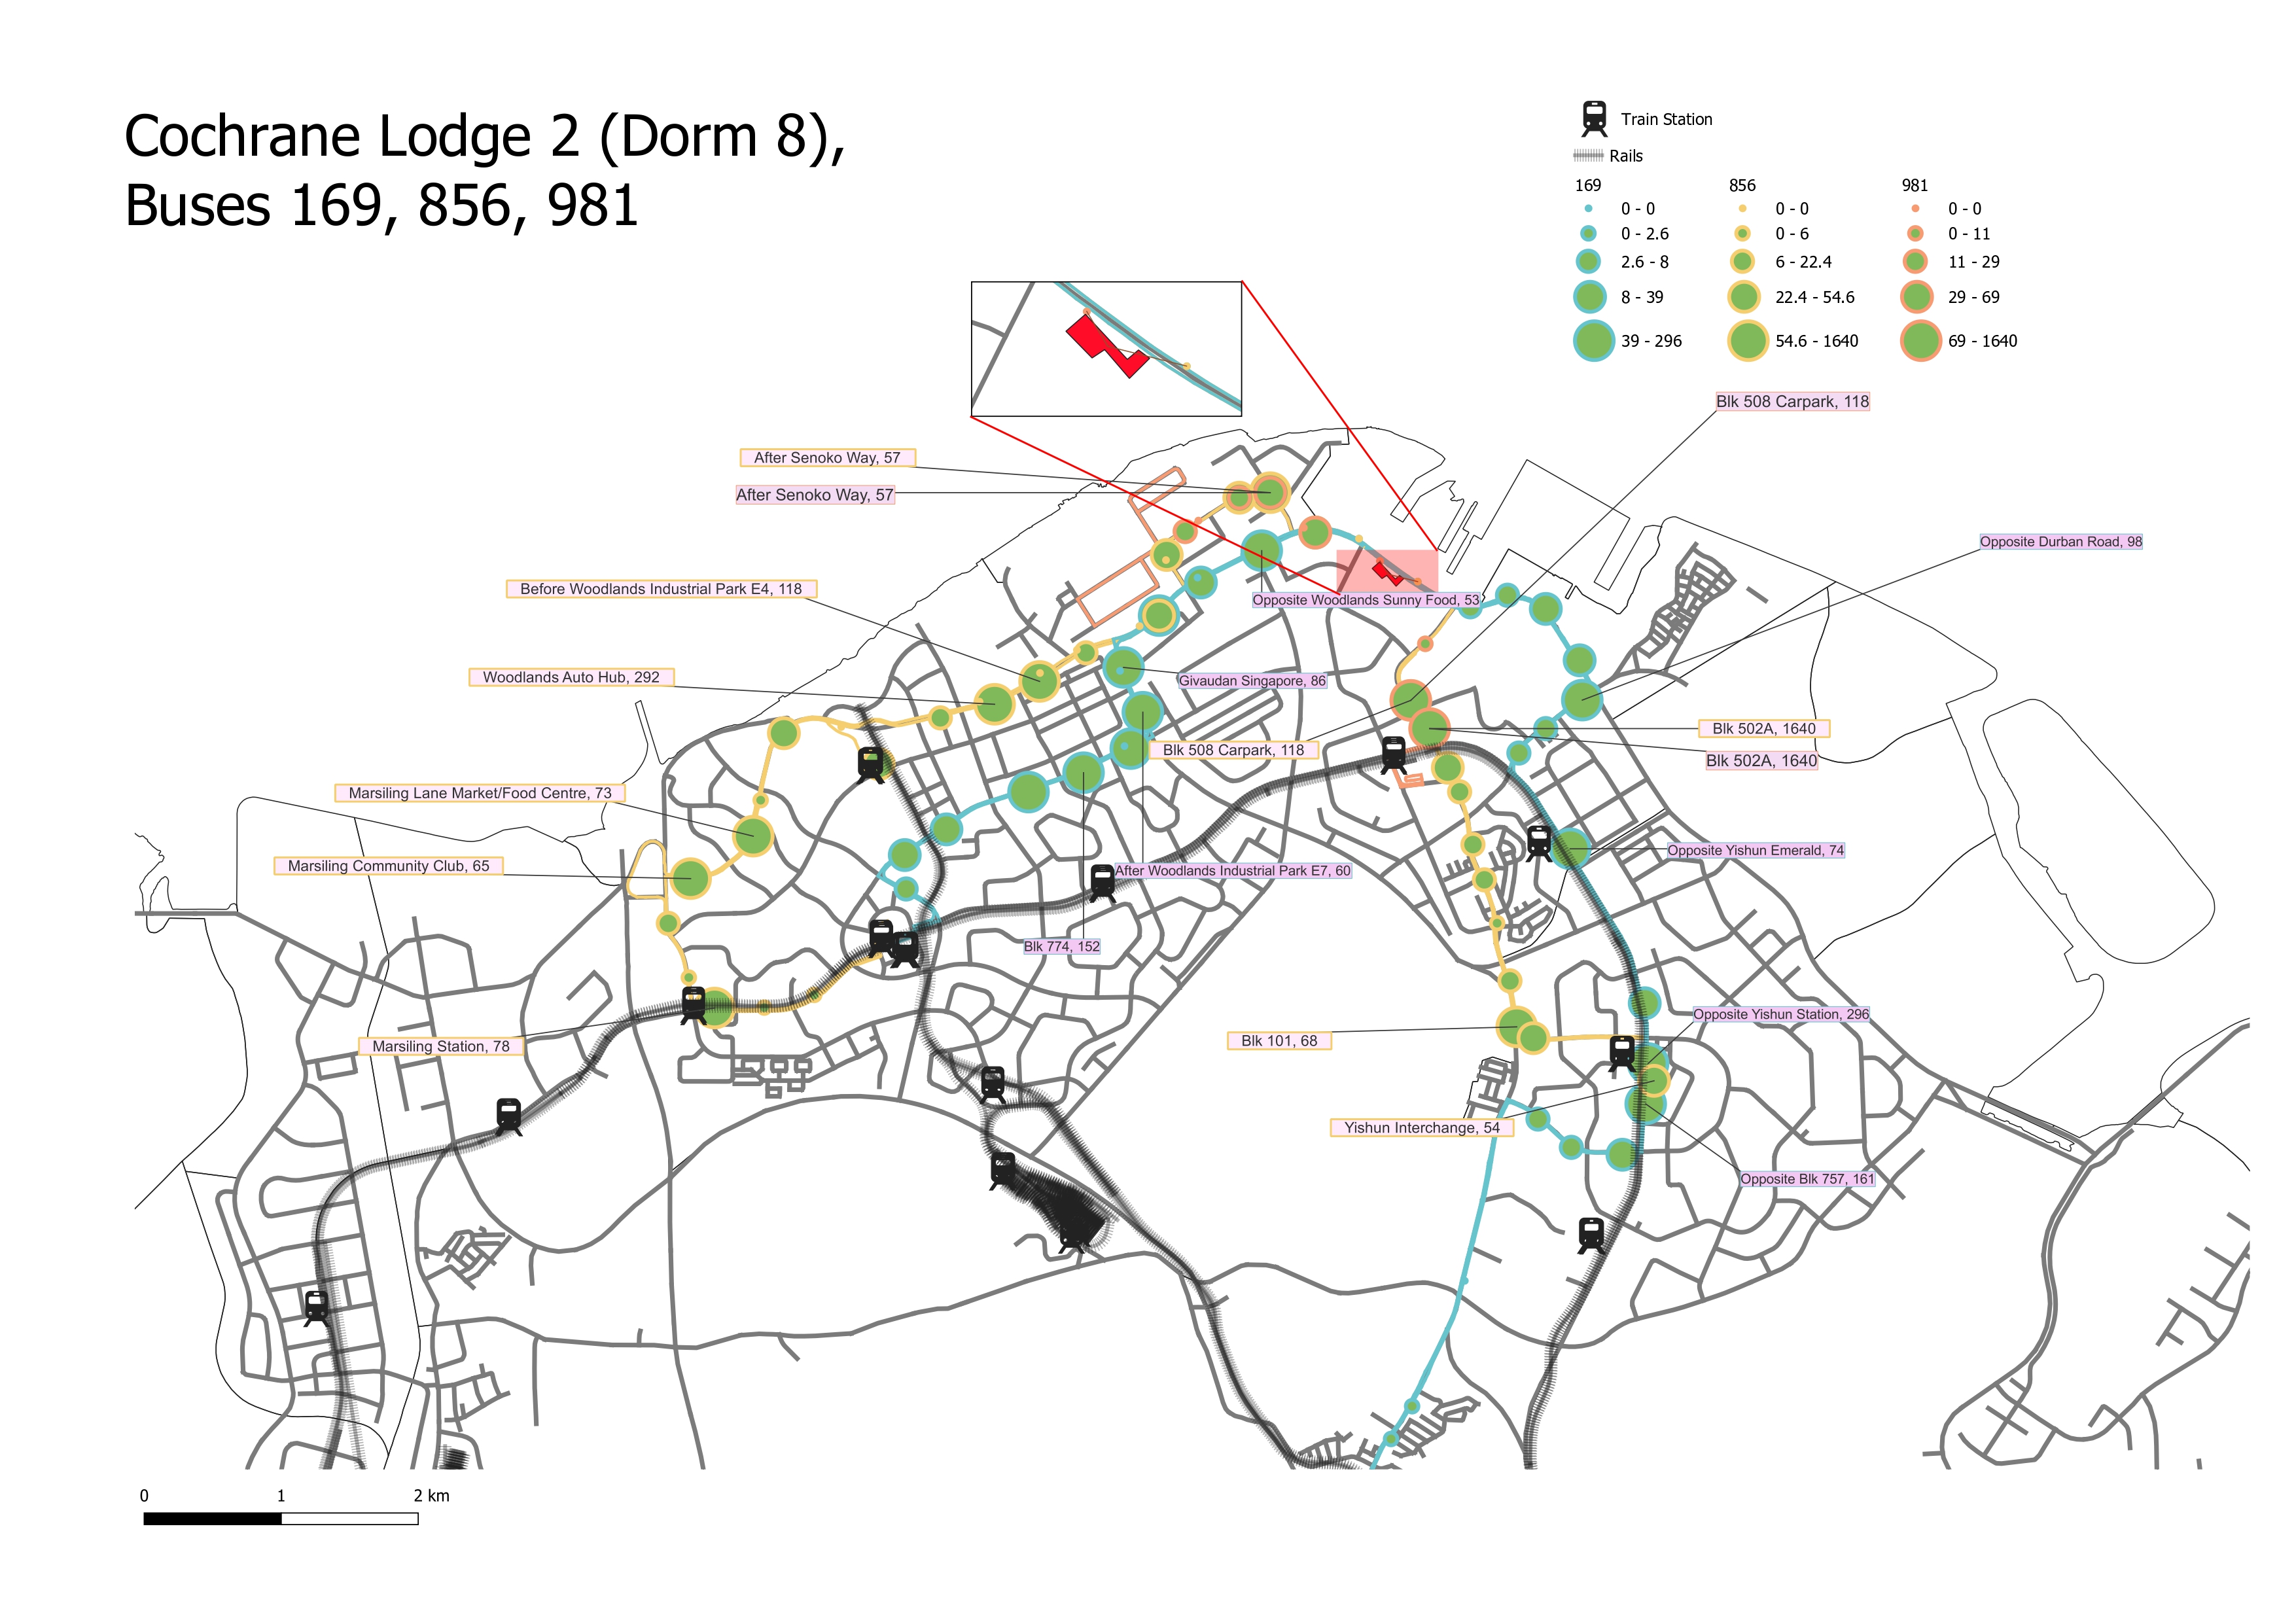
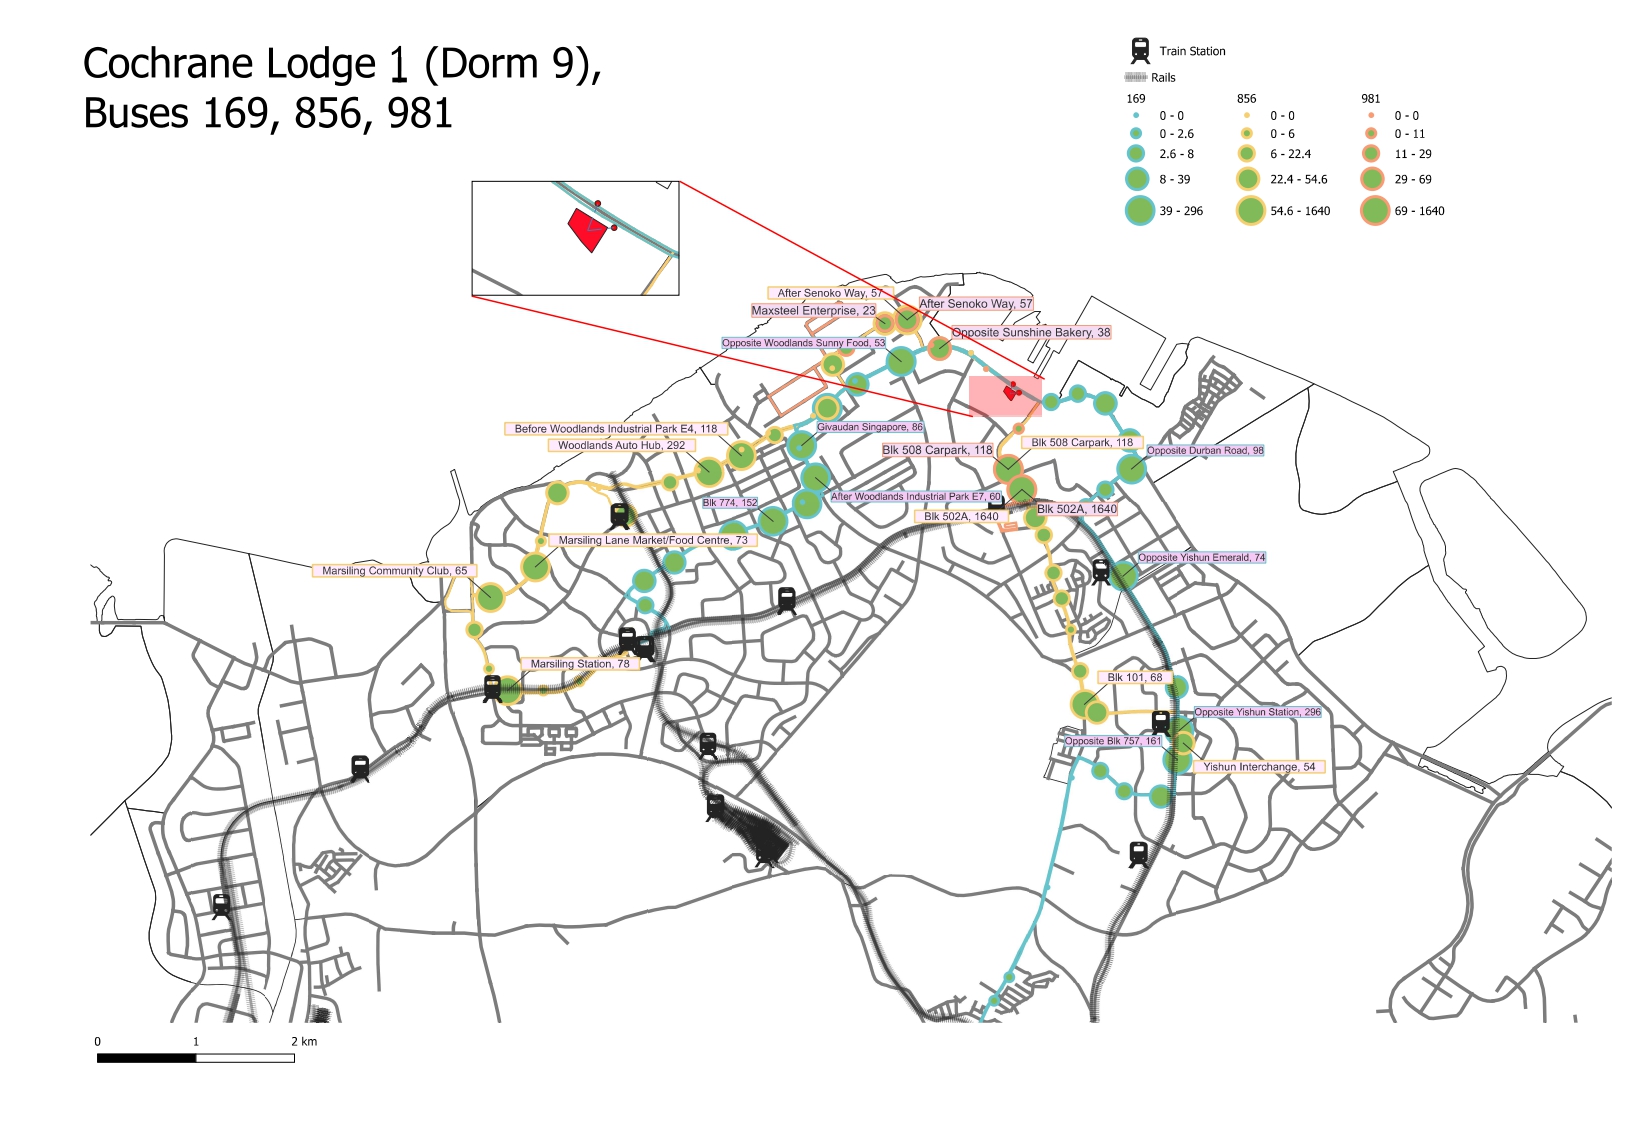
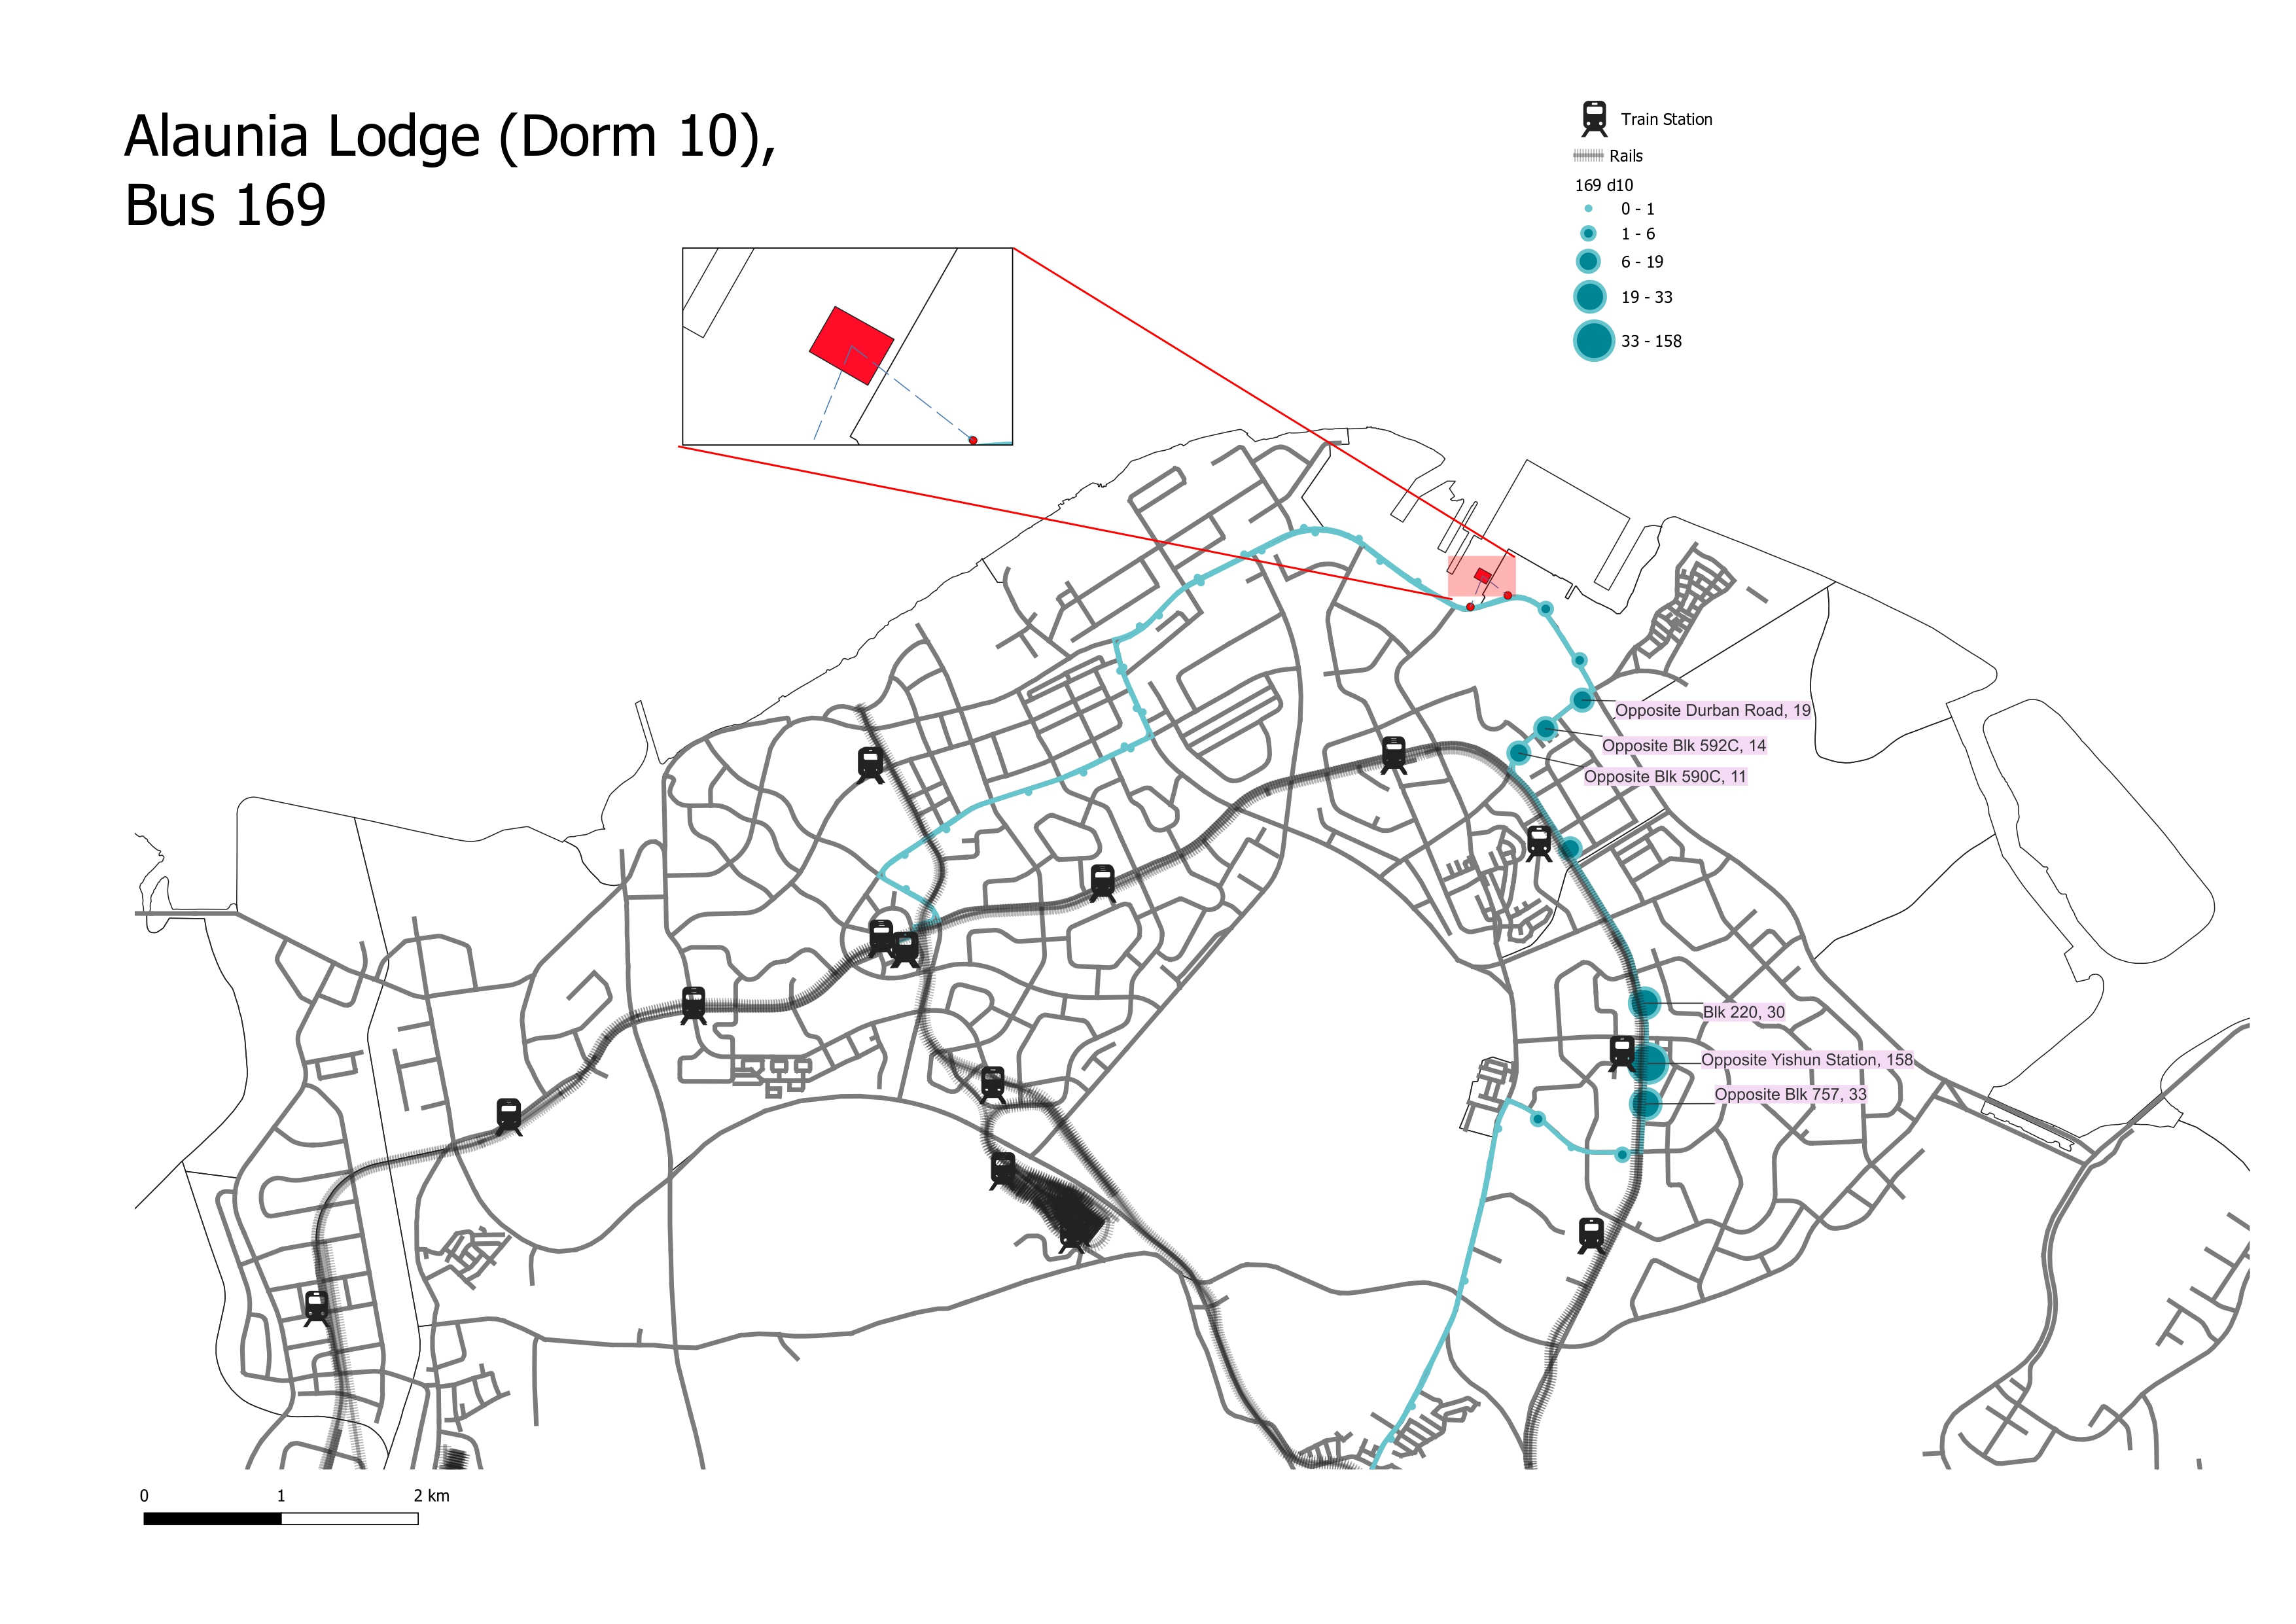
Summary
Migrant worker dormitories that are located deep within industrial areas lack access to amenities in general. This information may help NGOs such as Healthserve to prioritise the setting up of services close to dorms that require longer travel times to clinics and supermarkets.
Further analysis can explore the shortest route by bus from dormitories to amenities and compare it with those living in HDBs.