Debugging in VS Code
Learning how to debug is useful, because when your project gets big, you don’t want to always write print statements to see where your code is breaking.
In VS Code, click the ‘Run & Debug’ button, then create a launch.json file. Add breakpoint wherever you want the program to stop running. To add a breakpoint, left click the line number you want the program to stop at and a red dot will appear. Run the debugger.
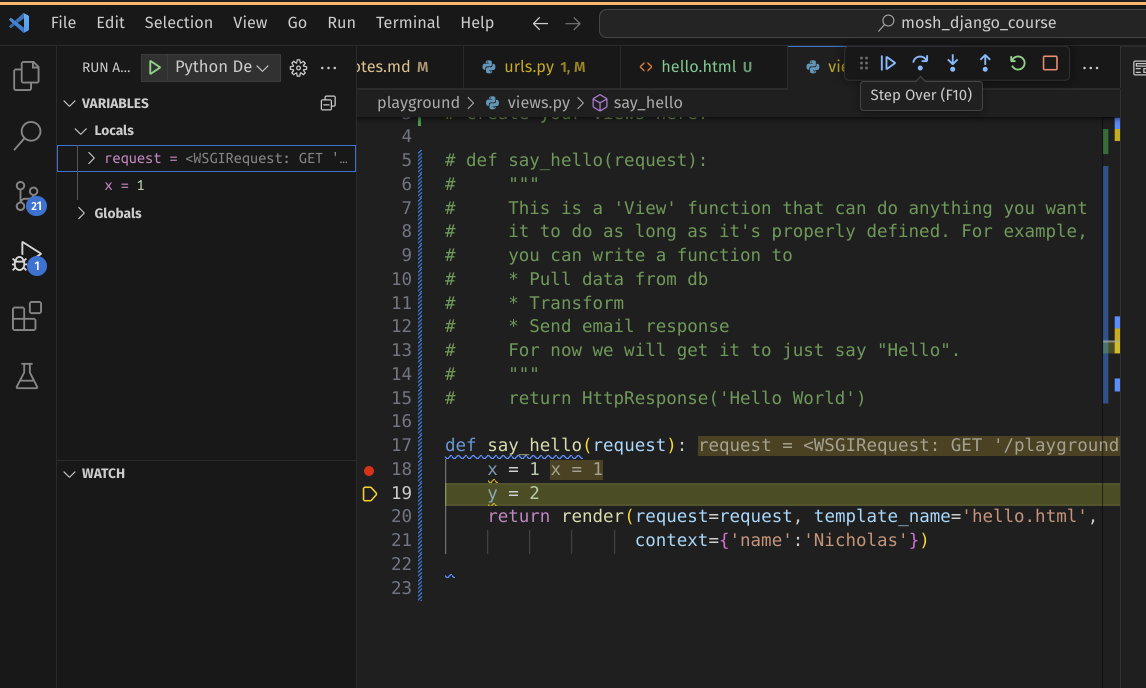
You can click ‘Step Over’ (shortcut F10) which will run the breakpoint line and go to the next one. In the example below, say you put a breakpoint at line 18. After ‘stepping over’, you’ll have a local variable x now.
Using ‘Step Over’ (F10)
You also have ‘Step Into’, which allows you to inspect what is going on within a function to check for bugs. The difference between ‘Step Into’ and ‘Step Over’ is that ‘Step Over’ will evaluate the function and return the output but ‘Step Into’ will go inside the function.
Using ‘Step Into’ (F11)
You can also ‘Step Out’ which returns you back to the line of the function call you were at previously.
Tip 1: Remember to remove your breakpoints after you are done debugging.
Tip 2: You can use CTRL + F5 to run the project instead of running the python manage.py runserver command in your terminal.